Forecasts and reports
Figures with their shape and their reason, never a chart alone.
Start here
Start with the complete picture.
Preview the pieces, then open the connected journey.
The journey
Follow a complete task.
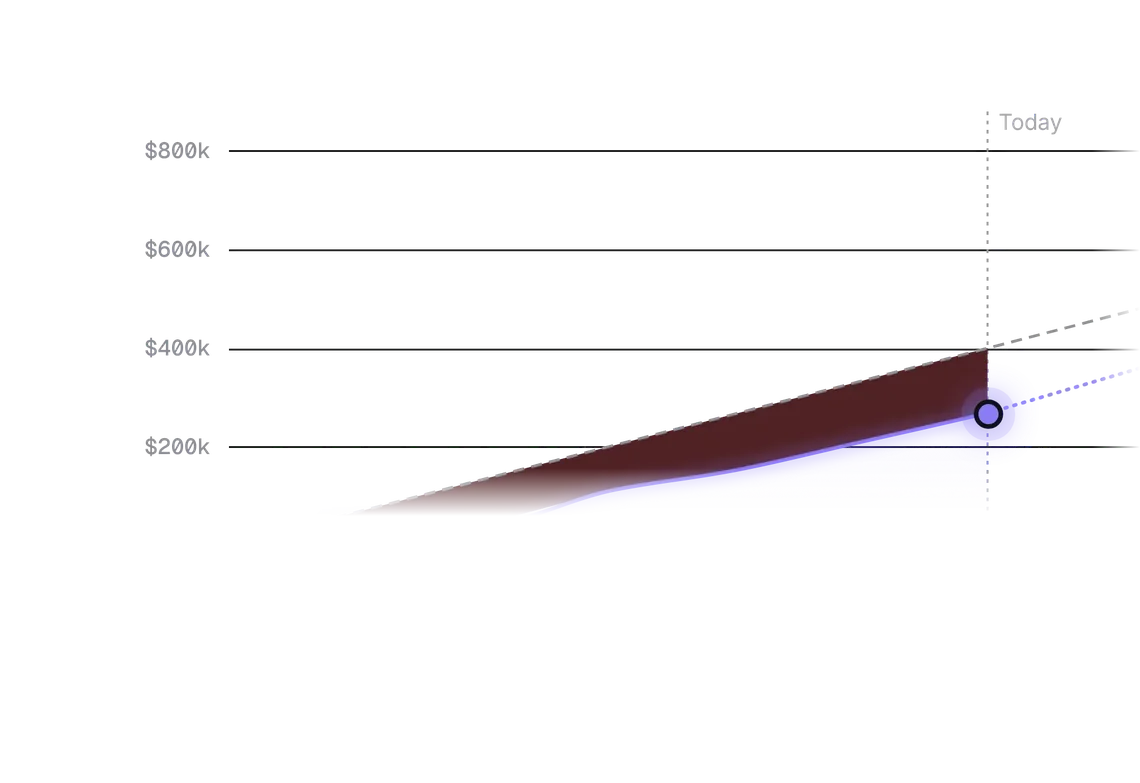
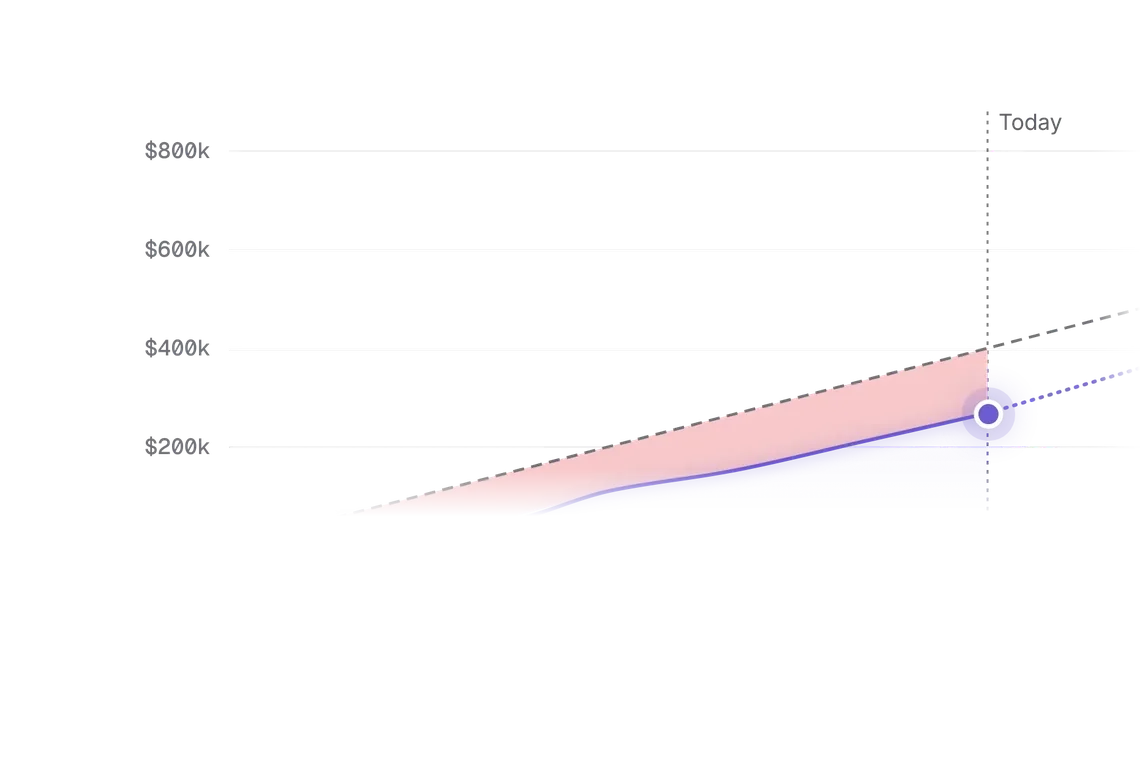
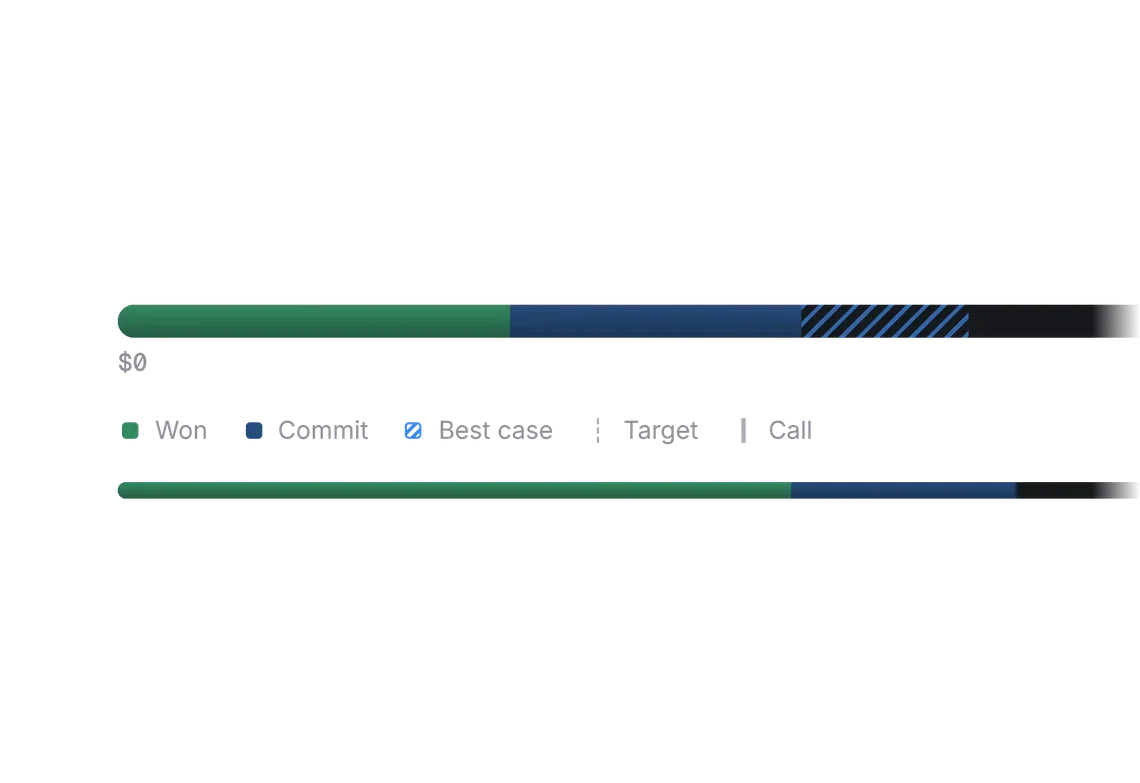
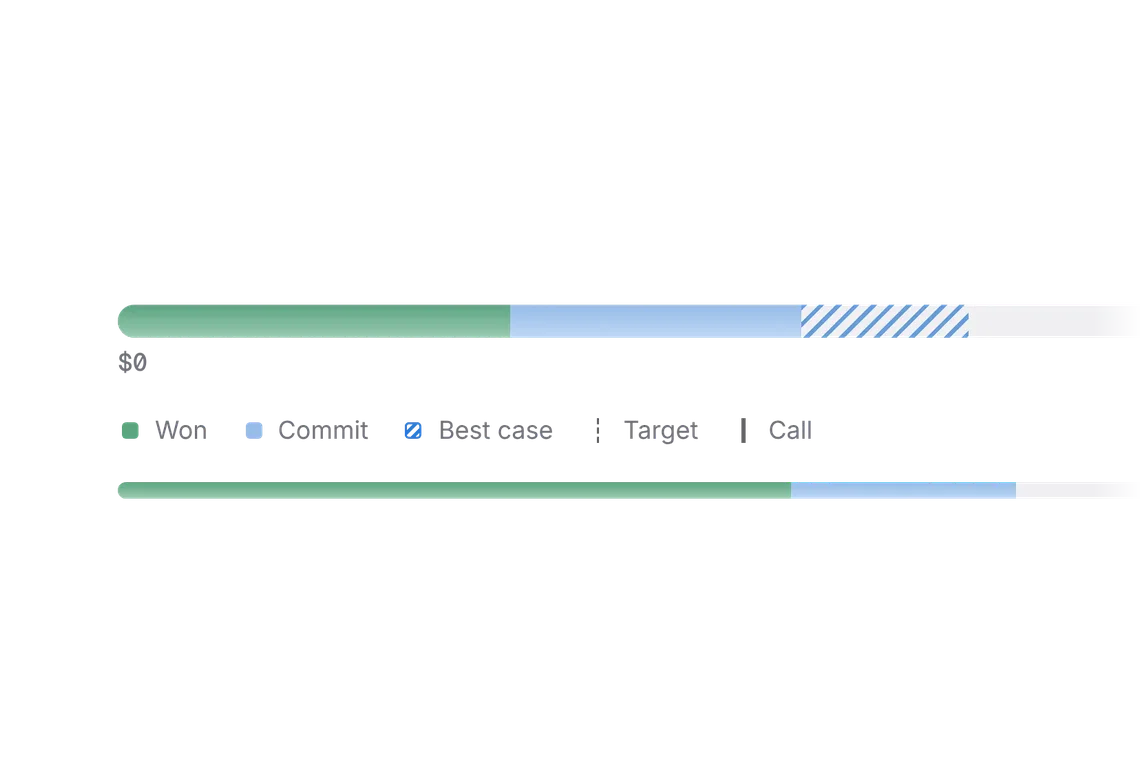
The figures a team runs on: forecast, attainment, what moved and why, with the number always written.
- Read the forecast against the target.
- Compare this period with the last.
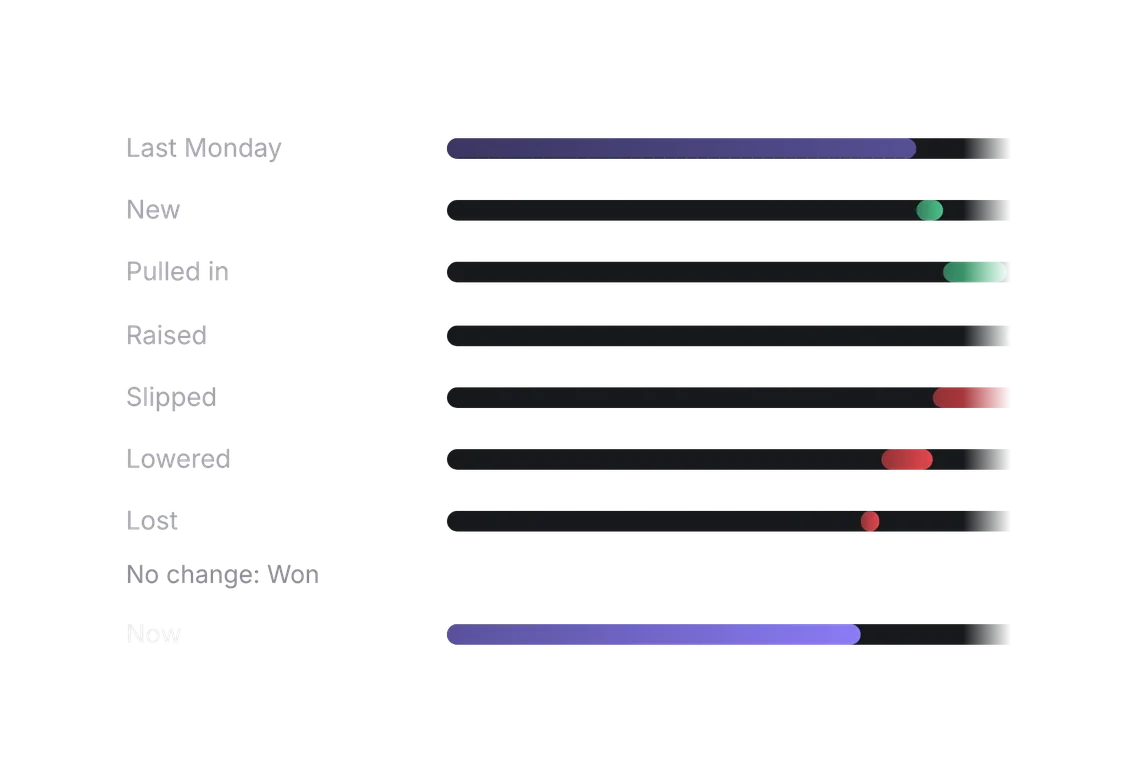
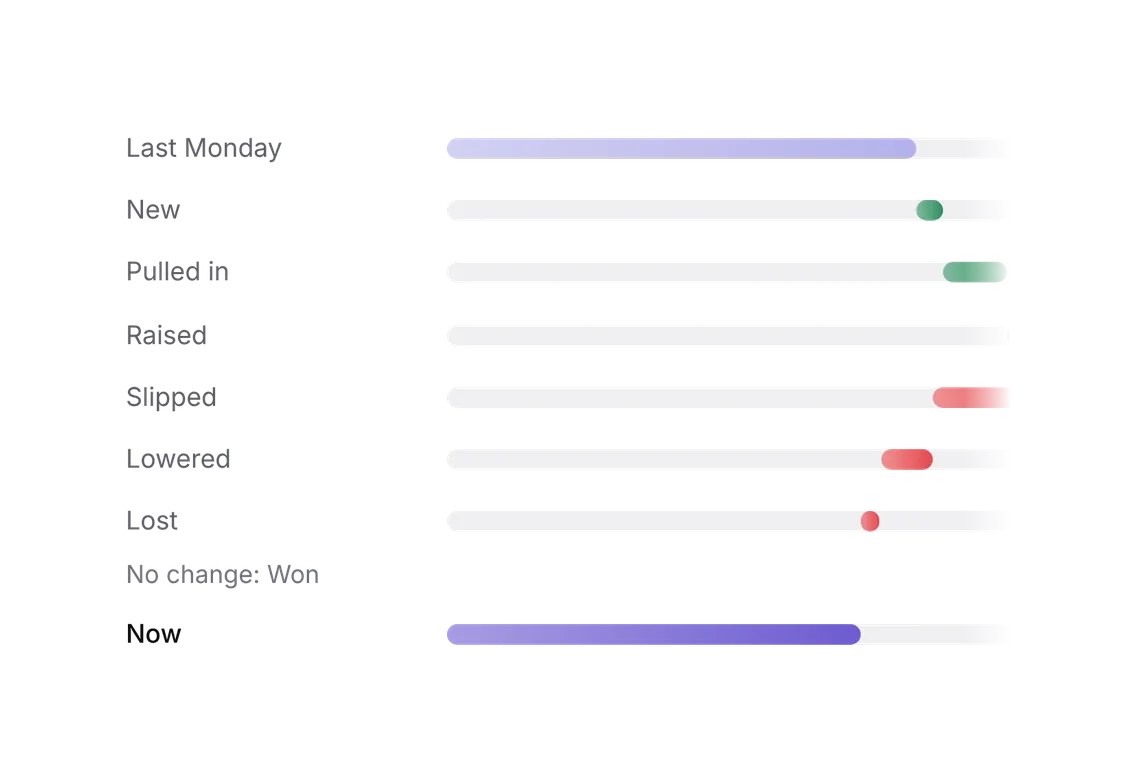
- Follow a change step by step in the waterfall.
States it handles
A target not met yet, a period compared with the last, a change explained step by step, no data yet.
Your application stays in charge.
The demo uses fictional figures. Your data source calculates the numbers; the components show them.
Own the source
Add the kit, or start with a few pieces.
Every piece installs with the shadcn CLI and becomes source in your repo. Free pieces stay free; Pro unlocks the rest of every kit.
Add the whole kit
With Pro, after the one-time registry setup. One set of files for any components.json style, Base or Radix; the primitives run on Base UI.
pnpm dlx shadcn@latest add @notchset-pro/cumulative-chart @notchset-pro/forecast-bar @notchset-pro/waterfall @notchset-pro/kpi-strip @notchset-pro/team-attainment @notchset-pro/movement-summary @notchset/sparkline @notchset/meter @notchset/tick-barStart with the free pieces
No account, no setup. One command for every shadcn style.
pnpm dlx shadcn@latest add https://notchset.dev/r/sparkline.json https://notchset.dev/r/meter.json https://notchset.dev/r/tick-bar.jsonNew project? Set up your project. The full kit includes Pro pieces and uses your authorized registry setup.
9 live pieces